The Air is Rare. What The Stock Markets of 1929, 2000, and Today Have in Common

How rare is our air?
What if I told you there have been only two periods since 1871 when stocks have been valued this high: 1929 and 2000? We know how those stories ended…
Well, depending upon whether you use the Case-Shiller CAPE ratio or my own Overvalued/Undervalued Index (OU Index for short), maybe 2-4% of the time has the stock market been this high.
The odds are the stock market will correct soon.
But when?
The answer: no one knows.
But I know numbers. And I know probability theory.
And the probability is in favor of a correction.
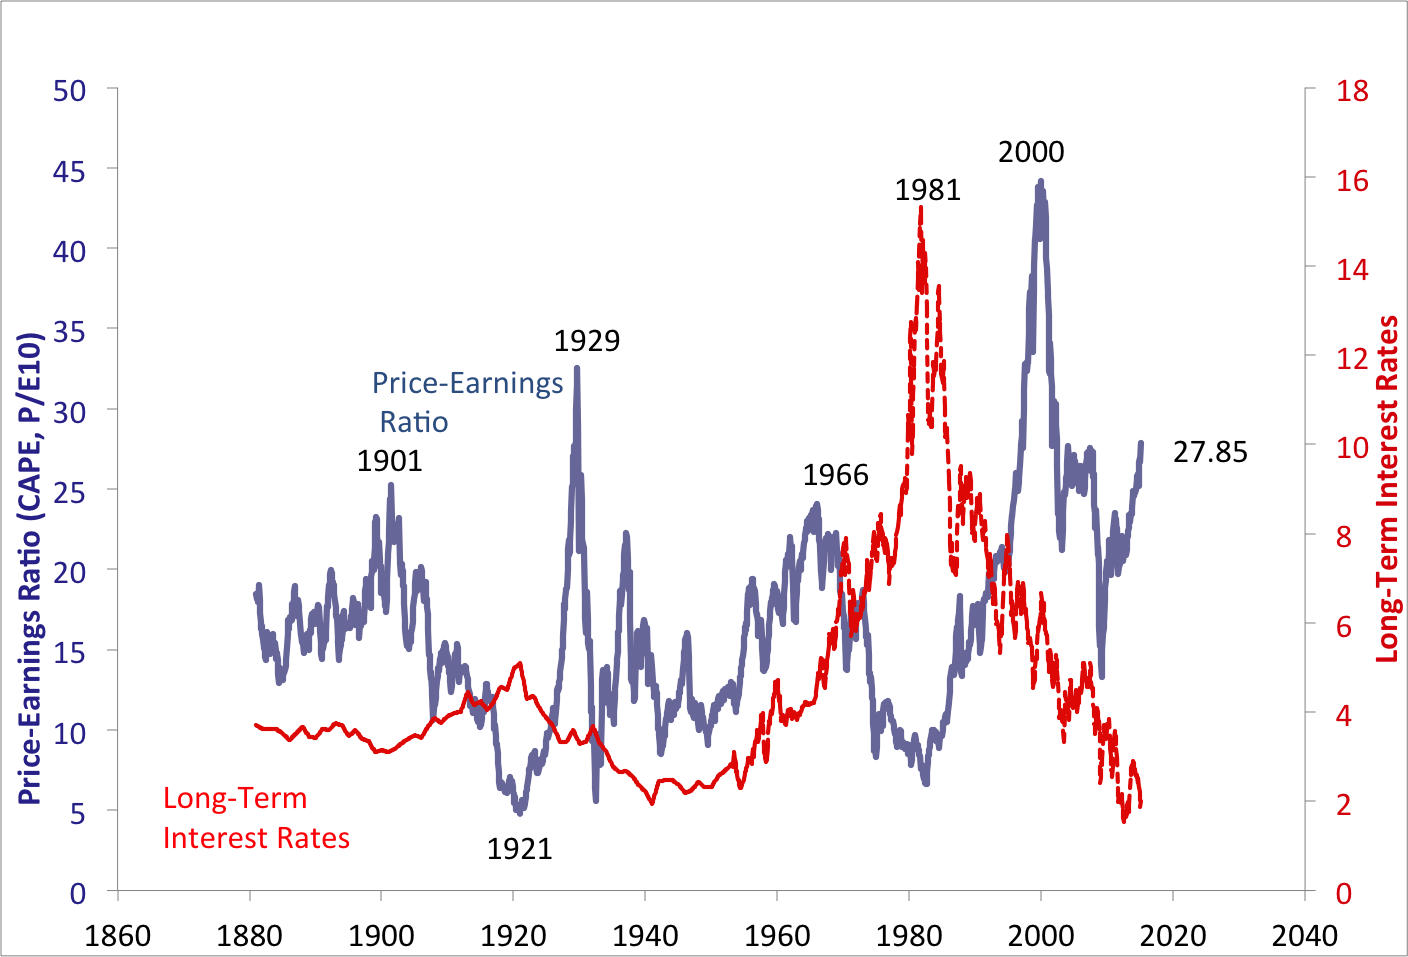
Let’s look at the Case-Shiller data and explain what the Case-Shiller CAPE ratio is. The CAPE ratio is a modified Price-Earnings ratio. It is the current price of a stock divided by the average of the last 10 years of earnings adjusted for inflation. The data consists of:
- 1729 Monthly data points from 1871 – 2015
- 69 times the CAPE has been 27.85 or higher
- The CAPE’s highest value ever was 44.2 in December 1999
- The CAPE’s lowest value ever was 4.78 in December 1920
- There is no CAPE for the first 10 years of the index because the CAPE requires 10 years of trailing data
Now, 144 years is a helluva lot of data by any person’s standards. It makes the 16 years of data I have for the OU Index appear like a mere drop in the bucket. I guess I will need 100 years or so of data for the OU Index to be taken seriously.
Here is how the CAPE ratio breaks down by percentages:
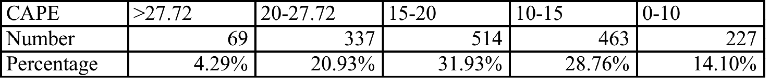
Let’s look closer at the times the CAPE was higher then 27.85. They are broken into three chronological blocks:
- June 1929 – October 1929. The stock market crash of October 28, 1929 ended the run. By November 1929 the CAPE dropped to 21 from 28.96 in October 1929, and the S&P comp lost 26% of its value.
- January 1997 – May 2002. Surely you recall the tech bubble. This 63-month run is longest the CAPE was over its current 27.85. It took over two years from the March 2000 tech bubble peak of 43.22 for the CAPE to go below 27.85. That shows you how big the tech bubble truly was.
- February 2015 - ?. The big question mark. We don’t know how large the bubble will grow before it pops.
Robert Shiller only won the Nobel Prize in Economics in 2013 for his work. Maybe that’s not enough to convince you.
How About My Overvalued/Undervalued Index?
The Overvalued/Undervalued index places stocks into three buckets and assigns a numerical value of 1, 0, or -1 to the stock depending upon the bucket. A company’s 10-year growth rate versus the company’s trailing P/E ratio determines the rating:
- Undervalued = 1. A stock with a P/E greater than 2X its 10-year growth rate or a PE greater than 50.
- Reasonably Valued = 0. A stock with a P/E of 1X to 2X its 10-year growth rate.
- Overvalued = -1. A stock with a P/E less than 1X its 10-year growth rate.
- The OU Index Value is determined by the average of all the stocks in the index.
The data consists of:
- 132 Monthly data points from 1998 – 2015
- Two times the OU Index has been -18.75% or higher (the more negative the number, the more overvalued the index has become)
- The OU Index’s highest overvalued point ever was -33.3% in March 2000
- The OU Index’s lowest undervalued point ever was 71.53% in November 2008
- The OU Index has been overvalued 65 periods versus undervalued 67 periods. About half of the time the OU Index has indicated the stock market has been overvalued. About half of the time the OU Index has indicated the stock market has undervalued. This is a good indicator of the OU Index’s accuracy.
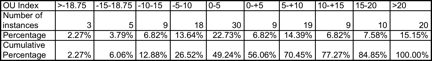
I’ve only been keeping data since 1998, but the OU Index has only been higher than its current -18.75% twice:
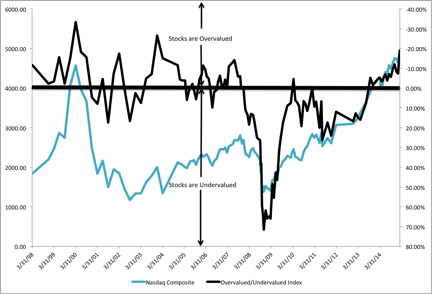
- March 2000. The tech bubble peak. The NASDAQ reached its peak of 5,048 on March 10, 2000. The OU Index reached its peak of -33.33% in March 2000.
- December 2003. The post bubble bounce. The NASDAQ reached its post bubble bottom of 1,114 on October 9, 2002. Then the NASDAQ bounced to 2,003.37, and the OU Index reached -26.51% on December 31, 2003. The NASDAQ was at 1,341.17 by March 31, 3014. That’s a 33% drop! Ouch!
Here’s the data on the OU Index:
I know what some of you are thinking. “It’s different this time”.
I am not buying it.
You don’t want believe me.
That’s fine.
Well, do you believe prominent venture capitalist Bill Gurley, an investor in Snapchat and Uber, among other notable startups? Gurley has been concerned about a bubble since 2014.
Gurley, speaking about his fellow VCs, said, “There is no fear out there,” at the SXSW conference in March 2015.
You say, “Who cares? It only affects startups.” No, it will not.
The economy is interconnected.
Gurley believes failing startups will also affect the revenue of none other than Facebook because Facebook receives advertising revenue from many startups. Obviously, there are other companies and industries failing startups will affect besides Facebook.
Here in the San Francisco Bay Area, failing startups will affect the booming real estate market.
Let’s revisit my neighbors. I had breakfast with my neighbor a couple of weeks ago. He and his wife are empty nesters. They have decided, after 18 years, to downsize. He put his house on the market the week prior.
I asked him how the open house went.
“Really well Brett. We had one guy make an offer well over asking price on the spot (at the open house). My wife and I are expecting two groups of offers. The first group of offers will be around the asking price, and the second group of offers will be around 20% over the asking price.”
My neighbor was wrong. My neighbor ended up selling his home, in an all-cash deal, for 35% over the asking price.
There are stories like my neighbor’s all over the Bay Area.
Now The Excesses of the Silicon Valley are Beginning to Show up Elsewhere.
I read an amazing article over the weekend. All I could think when I read it was this is going to end badly.
The article detailed how newly minted Silicon Valley millionaires are buying second homes in Los Angeles. They are spending weekends in LA for the warmer climate and commuting to the Bay Area during the week.
So, now the LA area real estate market is effected by the tech bubble. Those second homes will be the first to be sold, at a discount, when someone needs cash.
There have been nine stock market corrections of 30% or more since 1900!
I did a little research just for fun. The Dow has fallen over 30% nine times since 1900. That’s almost one 30% correction every 10 years:
| Year | Dow Drop | Recovery Date | Total Recovery Time |
| 1901-1903 | 46% | July 1905 | 2 Years |
| 1906-1907 | 49% | September 1916 | 9 Years |
| 1916-1917 | 40% | November 1919 | 2 Years |
| 1919-1921 | 47% | November 1924 | 3 Years |
| 1929-1932 | 89% | November 1954 | 22 Years |
| 1939-1942 | 40% | January 1945 | 3 Years |
| 1973-1974 | 45% | December 1982 | 8 Years |
| 2000-2002 | 36% | September 2006 | 4 Years |
| 2008-2009 | 52% | April 2011 | 2 Years |
| Average | 49% | 6 Years | |
| Median | 46% | 3 Years |
Okay, I believe you. There is a bubble. What should I do?
Here are the questions I ask myself:
- Do I have enough cash to live on for at least two years? Not stocks, but cash. Why cash? Well, stock market corrections have a weird way of happening at the same time as a recession. Companies lay off employees in recessions, and you don’t want to have to sell your investments at a discount during a recession.
- Did I panic and sell during the last downturn? Why do you think you will behave any differently this time? You likely will not. That’s okay, but sell now before things get rough.
- Did I have the balls to invest during the last downturn when the market was way down? Congratulations if you did because you likely made a lot of money. Just have your “dry powder” (cash) ready for the downturn.
Your answers to these three questions should give you a really good idea of what to do now before the stock market bubble bursts.
Here’s what I am doing:
- I am building a war chest of cash. Every month, I am continuing to sell off a percentage of my portfolio in anticipation of the correction.I may be giving up some gains today, but that’s acceptable to me. I have dry powder waiting for the correction.
- I am rebalancing my portfolio. Great. I’ve made the decision to sell, but what should I sell? I start with the high P/E growth stocks. Those are likely to be hit the hardest during a downturn.
- I continue rebalancing my portfolio. Next, I make sure I am not overexposed to any one stock, or any one sector. I will sell stock to keep the portfolio in balance.
- I do research to prepare for the upturn. You know how Amazon.com has the “wish list” button? Well, I do the same thing with stocks. I research what stocks I want to buy when they go on sale.
- Finally, I patiently wait. This is the hard part. We feel like we've lost something when we sell as the market continues to go higher and higher. I just keep reminding myself that the bubble will pop.
Why is it so important to sell or rebalance your portfolio before the correction?
Let’s say you have a stock portfolio of $1,000,000. The stock market has a 30% correction, and you:
- You sold half your stocks before the downturn. You would have:
- $500,000 in cash
- and your stock portfolio would be at $500,000-$150,000 = $350,000.
- Your portfolio of stocks and cash would be at $850,000
- You would need your portfolio to increase by 17.6% ($850,000 x 17.6% = $150,000) to get back to $1,000,000. That’s not bad.
- Didn’t sell anything. You would have a stock portfolio of $700,000.
- That’s a 30% drop
- You will need a 42.85% increase to get back to $1,000,000 ($700,000 x 42.85% = $300,000). That’s not easy to make up.
Now, let’s make it even worse. You lose your job, and you need $100,000 during the next year to survive.
- If you sold half of my $1,000,000 portfolio before the correction you have after 1 year:
- $400,000 in cash
- a stock portfolio of $350,000
- A total portfolio of stocks and cash of $750,000
- You need your portfolio to increase by 33% ($750,000 x 33% = $250,000) to get back to $1,000,000. A tough position, but you can recover.
- If you didn’t sell anything and you have to sell stocks at a discount to survive, you have a stock portfolio of $600,000.
- That’s a 40% drop!
- You will need an 66.66% increase in your portfolio to get back to $1,000,000 ($600,000 x 66.66% = $400,000). That will take you years to recover from.
Remember, it takes 6 years, on average, for the market to correct.
In every speculative bubble that ever happened, some “expert” said, “It’s different this time.”
This bubble will be no different.
Here’s what we don’t know: February 2015 -?.
What is the date of the ?. No one knows.
Life is unpredictable! Bad things happen to really good people. You can take steps now just in case something unpredictable happens.
Like what you read? Click here for more advice for startup CEOs.
Picture: Depositphotos
CAPE Index graphic and data courtesy of https://www.econ.yale.edu/~shiller/data.htm