San Francisco is on Fire – When Will the Stock Market Bubble Burst Again?
I was giddy, but I was scared to death. I knew at some point the stock market was going to crash, but I didn’t want to miss out on the boom. It was paralyzing…well, almost.
That’s how I felt in 1999 before the stock market crashed. I knew, deep down inside that I needed to do something, but the question was what I should do. I’ll flash back to 1999 in a moment, but first, let’s return to the present.
I wake up and I turn on the TV. What do I hear?
“San Francisco is on fire!” the CNBC commentator exclaimed.
“We have a goldilocks market right now!” yelped another commentator.
“This bull market still has a lot of room to run!” promised yet another.
You know what? They’re right. The Silicon Valley and San Francisco are booming again.
I was having coffee with my friend Cathal at Peet’s in downtown Los Altos at 10AM on a Wednesday, and it was packed. We “enjoyed” a ten minute wait to get our lattes, and we had to find a place to sit almost a block away from Peet’s, not the worst thing in the world when it’s 70 degrees outside.
Cathal and I looked at each other, and we both had the same thought: “What are all these people doing?”
I had another thought, “This reminds me of the Valley in 1999 and early 2000.”
There are a lot of parallels:
The housing market is going crazy in the Silicon Valley.
Commercial rents are going through the roof, especially in San Francisco.
Companies with no revenue, or with no plan for revenue, are being valued in the billions.
That being said, it does feel different. I can’t say why, but it just does. It’s not as crazy as the bubble, but it’s not good.
The NASDAQ is at its highest level since 2000. The S&P 500 just passed 2,000 for the first time. The pundits are slugging it out about how long the bull market can keep going.
Me? I am guided by Warren Buffet’s great quote on the market, “Be fearful when others are greedy, and be greedy when others are fearful.”
I enjoy watching my portfolio soar ever higher.
Fantastic, I think. But, I have to fight the feeling. I’ve been through this before.
I remember how I felt then. Okay, cue the flashback music, and…we’re back in 1999!
I began managing my own money a few years earlier. It was a bad time to start managing your own money despite the growth in the stock market. Why? You believed you could do no wrong, and that could lead to disaster. Two books I read helped prevent financial ruin:
The Intelligent Investor, by Benjamin Graham. Graham was Warren Buffet’s mentor. Buffet considers The Intelligent Investor, first published in 1949, “by far the best book on investing ever written.” It’s a tough read, but well worth it. There are so many valuable nuggets that I’ve dog-eared a ridiculous number of pages. Graham’s simple advice on how to value stocks based on a ten-year record of earnings is really worthwhile. I now use it as one of my stock evaluation tools.
Extraordinary Popular Delusions & the Madness of Crowds, by Charles Mackey. Mackey’s 1841 book on manias through history including the famous Tulipomania that gripped Holland in the early 17 century is a cautionary tale. To me, the most powerful comparative bubble to 1999 was the “South Sea Bubble” story. All the parallels were there: stocks rising to insane levels in an instant, the 18 century version of day-traders, speculators, and inevitably the participation of the general public. The stock crashed when the general public began participating.
I knew that what we were going through in the late 1990’s would end badly, but I didn’t know when the crash would come, and I still wasn’t sure how overvalued the market was.
I needed one more push. The power of ever-increasing wealth is intoxicating. I needed to prove for myself whether or not we were truly in a modern-day “South Sea Bubble” or not.
My first method was not very scientific at all. I looked at a graph of the NASDAQ in the newspaper, and I drew a line through the average growth rate:
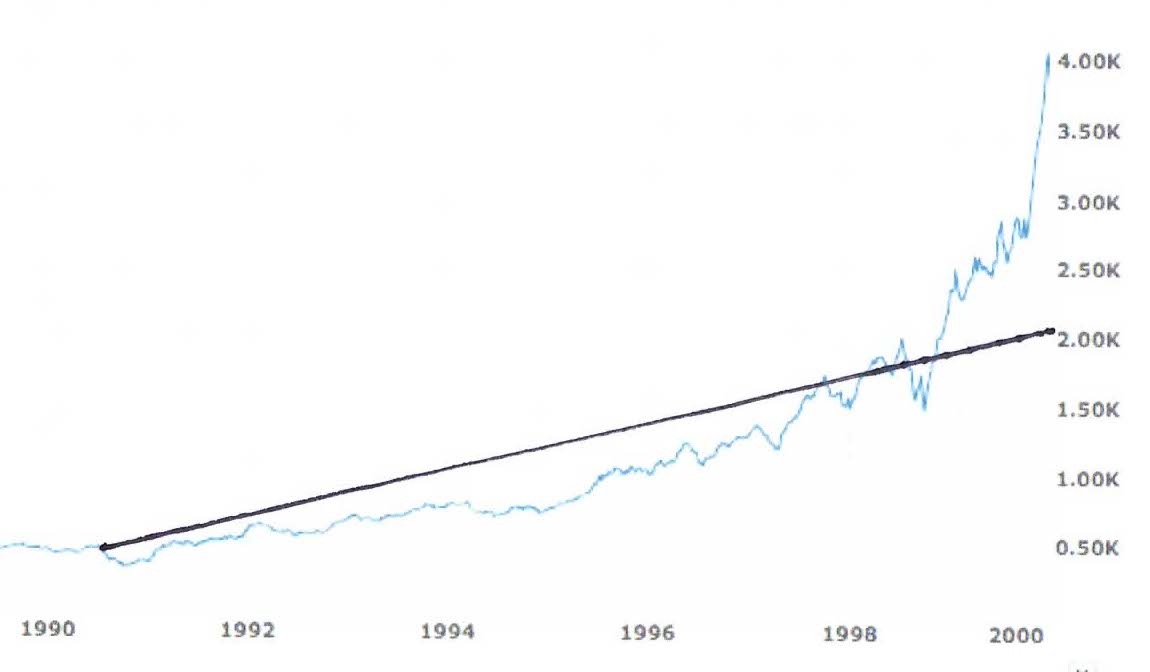
The “ruler” method indicated the NASDAQ should be at 2200 or lower, not the 4000 or so it was trading at.
The second method was more scientific. I developed a systematic methodology for determining if a given stock is undervalued, overvalued, or reasonably valued based on a stock’s ten-year earnings history. The method is partially based on Graham’s methodology to determine the earnings growth of a given company, and it’s partially based on Peter Lynch’s methodology to determine a company’s Adjusted Price to Earnings Ratio. I typically track between 100 and 150 companies. The stock market is overvalued if more of the stocks I am tracking are overvalued then undervalued. I called it the Undervalued/Overvalued Index:
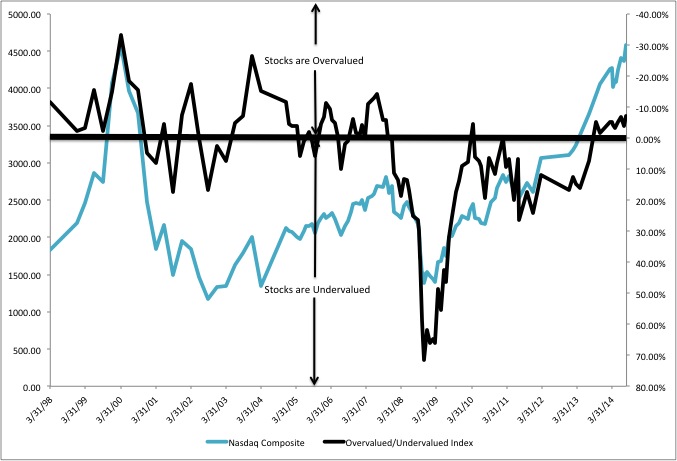
That was the clincher for me. There were too many indicators that the stock market would correct. Over 30% of the stocks I was tracking were overvalued in 2000. I needed to start selling, and I did. I now had a disciplined, simple, and methodical way to manage my portfolio:
Sell any stock that is overvalued regardless of what the overall market is doing. My rule is a stock is overvalued if a stock is trading at over twice, based on the PE ratio, the ten-year growth rate.
Rebalance your portfolio when more stocks are overvalued than undervalued by trimming your positions in your largest holdings. Don’t own too much of any given stock, and don’t keep too much of your holdings in any one sector. Diversification is your friend.
Rebalance your portfolio keeping a minimum amount of cash on hand as a percentage of your overall net worth. It doesn’t matter what the percentage is, just be vigilant. Cash on hand, or “dry powder”, is great, so you can take advantage of the inevitable corrections and crashes that happen.
Be a buyer of stocks when more stocks are undervalued than overvalued. I want everything in my favor when I buy a stock. I want the market to be undervalued, and I want the stock to be undervalued when I buy. Do your homework and be disciplined.
Perform this analysis in regular increments. I perform the above four steps every month, and then I buy, sell, or both depending upon the results.
I have been using this methodology ever since 1999 with excellent results. You too can develop your own disciplined methodology.
What happens when the market is undervalued?
You have to fight your fear. I used the dry powder I was sitting on to buy during the dips, especially during the Great Recession. It wasn’t easy to do, but every month, when I found a stock that met my criteria, I bought. It scared the you-know-what out of me, but I knew I was doing the right thing.
It’s almost like you have to do the reverse of what you are feeling: greed is an indication you should sell, and fear is an indication you should buy.
What do I think the stock market will do in the next 12 months?
I don’t have a clue. Maybe it will keep going up like it did in 1999 and early 2000. Maybe it will stabilize. Maybe we will have a soft correction. Or, maybe we will have a major correction.
No one knows.
Enter the CAPE Index
The only thing I know is the Overvalued/Undervalued Index and the CAPE Index indicate the market is richly valued. The Cyclically Adjusted Price Earnings Ratio, or CAPE, was invented by economists John Campbell and Robert Shiller. I didn’t know about CAPE in the late 90’s bubble, but I wish I did. The CAPE is a stocks price divided by the 10-year earnings history adjusted for inflation, so it is similar to Benjamin Graham’s work. Shiller compiled data all the way back to 1881. Take a look at the data:
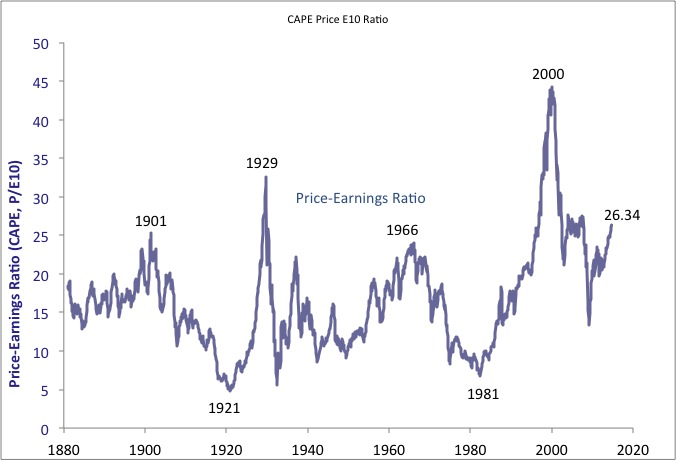
Wow!
Just look at the 2000 peak!
It’s even higher than 1929.
I wish I would have known about Shiller’s work during the bubble, but at least I had the Overvalued/Undervalued Index to guide me.
I can use both together today:
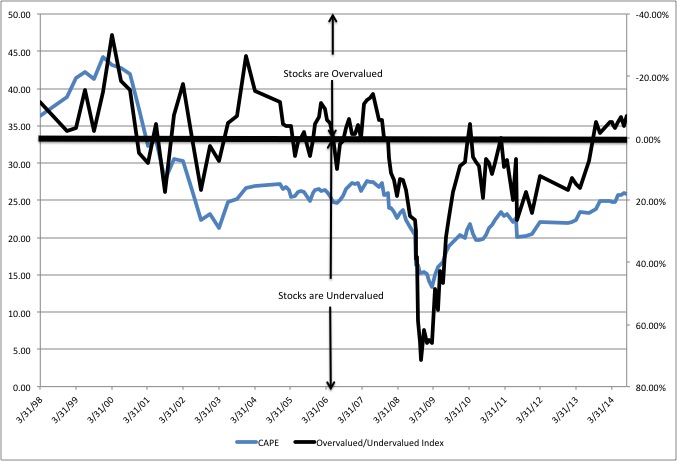
Here we are in September 2014, and the CAPE is at 26.34. The CAPE has rarely been higher. The Overvalued/Undervalued Index indicates the stocks are 7.3% overvalued.
I don’t know when it will happen, but the market will correct. It always does.
That’s all for now,
Brett